on
Polling
This week, we studied various polling methods and tried to explain the variance among pollsters. Why are polls inaccurate and how can we improve upon them? In this blog, I will add polling data to the economic data we looked at last week in an attempt to improve my model and generate better predictions for the upcoming midterm election.
Polling Data
When first considering how to add this polling data to my forecasting model, I decided that I would filter the data in order to make it more representative of this year’s upcoming midterm election. The polling data captures polling results from 1945 to 2020, but there are various reasons as to why I have chosen not to use all of this. In class last week, we discussed how Republicans gained power in the House in the 1990s for the first time in a long time. Going off of the assumption that these races were more competitive than races from 1945-1988, and therefore more closely resemble the election we are trying to predict, I will limit the data to only elections after 1990. I believe it is also reasonable to assume that polling methods have changed since 1945, so a more recent sample will hopefully produce better, more predictive results. In addition to filtering for more recent years, I also chose to filter for midterm years, removing the years in which there was a Presidential election. As we have discussed in class and seen in other forecasts, elections in Presidential years are fundamentally different than midterm elections: there is a different voter base, campaign techniques, etc. I think limiting the polling to midterm years will create a better prediction for this year than using all of the polling data would. While this week’s focus was on polling, I will be building upon models from previous weeks that use economic and historical data in hopes that all the factors together will be able to build a more predictive model.
To start, I wanted to look at the filtered polling data to see how predictive it is. The polling data is taken from a generic ballot measured in “support” for each party, with a value for each poll’s predicted Democratic and Republican support as a percentage (but the two do not add up to 100%). To understand the predictive power of this generic ballot poll on the actual election results, I created a residual-esq variable that measures the actual party support from that year’s election minus the generic ballot’s measure of support. I then plotted this variable against the days until the election to see if they are more predictive as the election gets closer, with the hope that people’s generic party support represents how they will vote in the election. The graphs of this relationship between the residual and the days until election by party are plotted below.
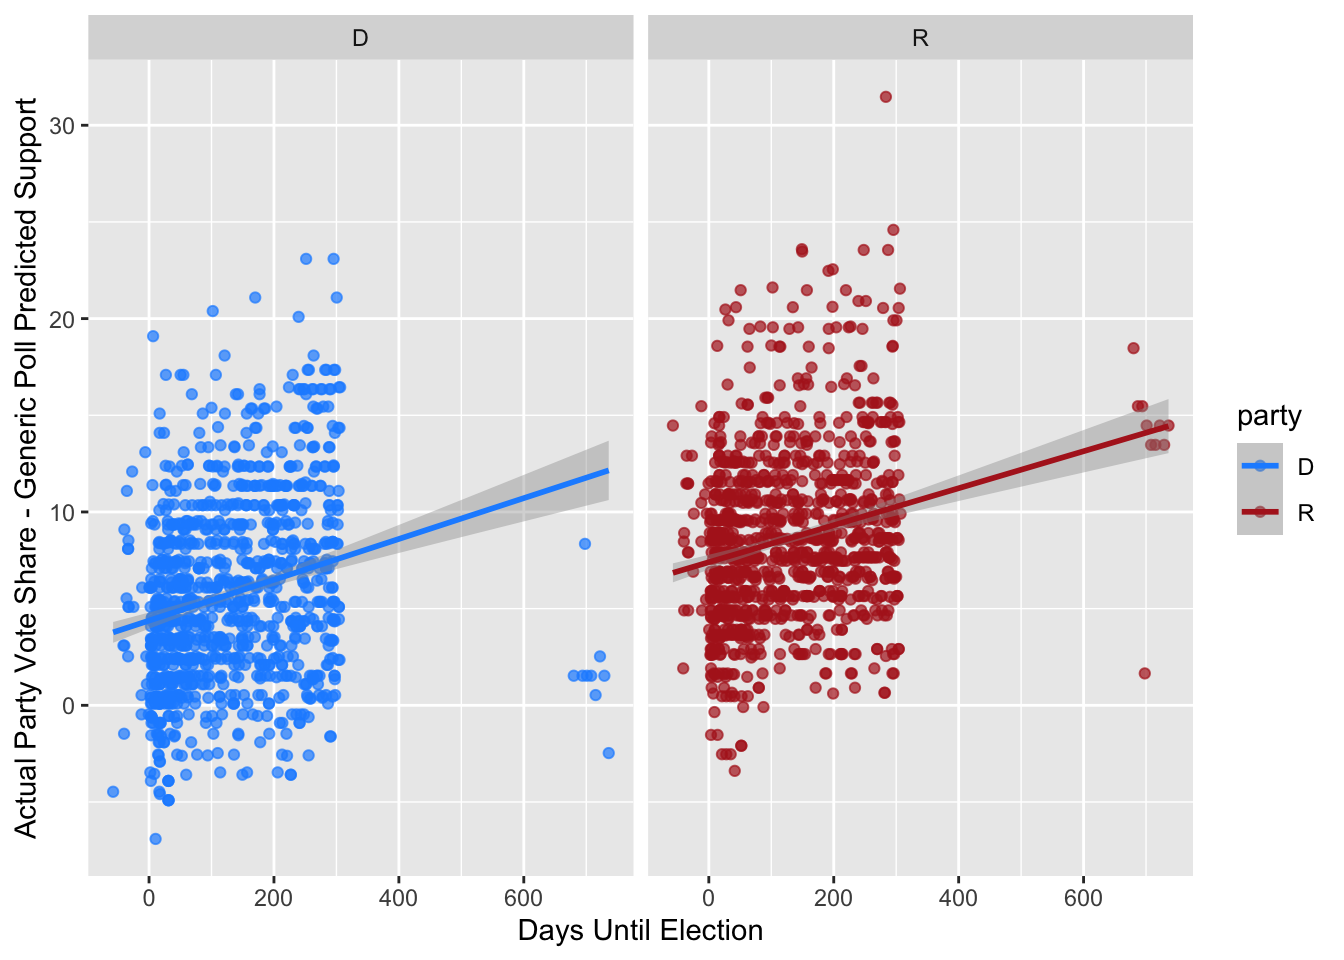
The two plots show a wide spread of poll results across all time periods, although we do see a slightly higher concentration of points as the election gets closer. If the polls perfectly represented the way people voted in the election (and assuming all the poll respondents voted), we would see the points along the line 45-degree line of y=x with an intercept of 0. As the line of best fit for each of these plots show, the intercept is positive for both parties, meaning the generic ballot poll predictions often underestimate the actual two-party vote share. This is expected, because both the Democratic and Republican parties often do not have the highest approval ratings and may not be loved by people, but when people go to vote, they have to choose a candidate even if they do not necessarily support the party altogether. The lines of best fit also show that while there is a slightly negative relationship between the days until the election and the residual-type variable – showing better accuracy in predicting the vote share closer to the election – the relationship is not very strong. As we read with Gelman and King (1993), polling is most accurate in the months before an election but respondents are not often rational or informed in their choices which is why predicting the outcome is not always accurate.
One interesting note is that on the Democrat side, the polls that were taken 600+ days out from the election are clumped around a residual of 0, showing that at that time, generic party support did fairly accurately mirror the party’s vote share in the election. The time frame of these points is a little less than 2 years prior to the midterm election, meaning these measurements come right after the previous Presidential election. Party support is likely high around this time and therefore corrects for the lack of support that we see later on.
Extension 1
In Nate Silver’s FiveThirtyEight forecast models, he explains that when it comes to House elections, polling is not as important. Their most predictive model, which they call the “Deluxe model”, combines a “Classic” model that uses local polling but adding many non-polling factors to it such as incumbency and past voting history. While their poll-driven model delivers results that are not much less accurate than the Deluxe model, they still are slightly less accurate. FiveThrityEight’s House forecasts use almost “all the polls [they] can find, including partisan polls put out by campaigns or other interested parties”. They also weight their polls based on sample size, recency, and pollster rating, and they adjust the polls using a likely voter adjustment, a timeline adjustment, and a house effects adjustment. FiveThirtyEight’s Classic and Deluxe models also “compare their current estimate of national political climate to a prior based on the results of congressional elections since 1946, accounting for historic swings in midterms years and presidential approval ratings”. Finally, the FiveThirtyEight models also project turnout to help project the relationship between popular vote and seat share.
In Morris’s The Economist forecast models, polling is very important. Similar to FiveThirtyEight, they use fundamentals, such as previous election results, and polling data. The Economist models stress the generic ballot, compared to FiveThirtyEight that used polls of all different kinds. The Economist also weighs polls that fall closer to the election more heavily.
I think the model I created this week more closely represents Silver’s FiveThirtyEight forecast, as I did not focus on polling like they do at the Economist as you will see below. I think both forecasts have their pros and cons, but I believe Silver’s model will be more accurate and a better predictor for the outcome of this election. In recent years, the polls have been unable to accurately predict the outcomes of elections, and therefore, I think we should rely less heavily on them as Silver does in the FiveThirtyEight models. I also like Silver’s approach to using all different kinds of polls, not just the generic ballot. While the generic ballot can give a sense of party sentiment, I do not believe it is the best predictor of seat share given that what seats are won by who is very complex with redistricting and other factors playing a role.
This Week’s Model
Now let’s get into the model. My model from last week’s blog was not a great predictor, with its R-squared being around 0.5 and contained some counter-intuitive coefficients likely due to multicollinearity. I decided to start fresh, only keeping the unemployment rate. I decided to go back to the political variables from Week 1, as well, and include president party and House incumbent party in the model for this week. The dependent variable for all of these models is the two-party vote share for Democrats.
| Dependent variable: | ||||||
| D_majorvote_pct | ||||||
| (1) | (2) | (3) | (4) | (5) | (6) | |
| Generic Ballot Support | 0.280*** | 0.154*** | 0.158*** | 0.097*** | 0.084*** | |
| (0.019) | (0.014) | (0.014) | (0.007) | (0.006) | ||
| President Party - Republican | 5.357*** | 4.930*** | 6.624*** | 20.389*** | 20.160*** | |
| (0.148) | (0.147) | (0.464) | (0.403) | (0.416) | ||
| House Incumbent - Republican | -1.765*** | -4.521*** | -4.791*** | |||
| (0.459) | (0.221) | (0.262) | ||||
| Unemployment Rate | -0.475*** | -0.464*** | ||||
| (0.025) | (0.025) | |||||
| President Party - R * Unemployment Rate | -2.641*** | -2.528*** | ||||
| (0.058) | (0.055) | |||||
| Constant | 38.255*** | 47.404*** | 40.742*** | 40.565*** | 46.618*** | 47.066*** |
| (0.873) | (0.120) | (0.621) | (0.619) | (0.351) | (0.337) | |
| Observations | 1,132 | 1,132 | 1,132 | 1,132 | 1,132 | 1,132 |
| R2 | 0.158 | 0.535 | 0.580 | 0.585 | 0.908 | 0.920 |
| Adjusted R2 | 0.158 | 0.535 | 0.579 | 0.584 | 0.907 | 0.919 |
| Residual Std. Error | 3.198 (df = 1130) | 2.376 (df = 1130) | 2.261 (df = 1129) | 2.247 (df = 1128) | 1.061 (df = 1126) | 11.586 (df = 1126) |
| F Statistic | 212.629*** (df = 1; 1130) | 1,302.472*** (df = 1; 1130) | 778.682*** (df = 2; 1129) | 530.408*** (df = 3; 1128) | 2,214.194*** (df = 5; 1126) | 2,576.418*** (df = 5; 1126) |
| Note: | p<0.1; p<0.05; p<0.01 | |||||
I decided to start off with two univariate regressions with one using the generic ballot party support as an independent variable - to get a taste of the strength of the relationship between the polls and the two-party vote share - and the second using President party as the independent variable. The generic ballot support model had a low R-squared of 0.158, which goes along with what we saw in the plots above. The Presidential party model has a much higher R-squared of 0.535, showing that this variable alone is a fairly good predictor of the vote share.
I added variables such as the House incumbent and the unemployment rate in Quarter 7, both of which improved the model. When I added an interaction between the unemployment rate and the President party, the R-square value increased a lot. As we have discussed in class and is well-known to people who follow political and economic news, unemployment rate is a good indicator of the health of the economy, and Republicans more heavily weigh economy in their voting preferences. Therefore, I expect that an interaction between these terms would add to the Republicans’ two-party vote share percentage, or in the case of this model, would have a negative coefficient.
In my final model for this week, Model 6 in the table, it includes the same variables as Model 5, however I added a weight of days until the election. As previously mentioned, as we get closer to the election, the polls become more indicative of voter preferences. Model 5 has an R-squared of 0.91 and Model 6 has an R-squared of 0.92, both of which suggest that these are very good predictors of the democratic two-party vote share in the midterm elections. All variables are significant at the 0.01 level, which is also very reassuring.
While I found this model to be a good predictor, I struggled this week trying to use it to make a prediction for the 2022 election. Specifically, I did not know how exactly to include the generic ballot support from polling into the prediction model. All of the other data I can find or source, such as President party, House incumbent, unemployment rate, and days until election. The coefficient on support in this model is very small, so I made my prediction by eliminating it and creating a new model with the remaining variables. The R-squared value remains very high at 0.91, so the model does not suffer from the exclusion of this variable. The new model fit is described below:
## MODEL INFO:
## Observations: 1132
## Dependent Variable: D_majorvote_pct
## Type: OLS linear regression
##
## MODEL FIT:
## F(4,1127) = 2760.66, p = 0.00
## R² = 0.91
## Adj. R² = 0.91
##
## Standard errors: OLS
## ------------------------------------------------------------
##                                  Est.   S.E.   t val.      p
## ----------------------------- ------- ------ -------- ------
## (Intercept)                     50.63   0.21   237.82   0.00
## President_partyR                20.60   0.44    46.30   0.00
## H_incumbentR                    -4.46   0.28   -15.95   0.00
## unrate                          -0.45   0.03   -16.65   0.00
## President_partyR:unrate         -2.66   0.06   -46.07   0.00
## ------------------------------------------------------------
Now using this new model to predict the Democrat’s two-party vote share in the 2022 midterm:
##        fit      lwr     upr
## 1 48.95346 48.72032 49.1866
This model estimates that the Democrats will receive 48.95% of the two-party vote share. I believe this seems like a logical estimation based on predictions from professional sources like FiveThirtyEight.
While I was unable to incorporate the polling data from this week into my model, it seems as though the generic ballot data may not have a strong influence on the predictive power of the model. I will try to use district-level polling in future models, as I believe they could be better indicators than the generic ballot polls.
Sources:
Gelman, A., & King, G. (1993). Why Are American Presidential Election Campaign Polls So Variable When Votes Are So Predictable? British Journal of Political Science, 23(4), 409–451. https://doi.org/10.1017/S0007123400006682